Munroe Sollog
2015-06-08 13:27:07 UTC
I have an inconsistency when I graph the same event over 10days versus 48hrs. I would expect
because I am using MAX that the peak on the 48hr graph and the 10day graph for the *same* event
would still read the same number. However, the peak for Sunday noon on the 48hr graph is at 600,
and the peak for that same period on the 10day graph is *higher* at 1.1k. I believe I have
included all the necessary files below. I didn't want to paste the raw info here as it would be
very large. Any insight would be appreciated. Thanks.
RRDtool 1.4.7 Copyright 1997-2012 by Tobias Oetiker <***@oetiker.ch>
Compiled Apr 5 2012 17:36:08
rrd info: https://pastee.org/qqxg8
48hr graph command: https://pastee.org/6yahu
10d graph command: https://pastee.org/gpk24
48hr graph: Loading Image...
10d graph: Loading Image...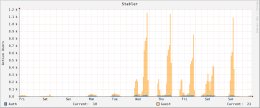
- --
Munroe Sollog
LTS - Network Analyst
x85002
because I am using MAX that the peak on the 48hr graph and the 10day graph for the *same* event
would still read the same number. However, the peak for Sunday noon on the 48hr graph is at 600,
and the peak for that same period on the 10day graph is *higher* at 1.1k. I believe I have
included all the necessary files below. I didn't want to paste the raw info here as it would be
very large. Any insight would be appreciated. Thanks.
RRDtool 1.4.7 Copyright 1997-2012 by Tobias Oetiker <***@oetiker.ch>
Compiled Apr 5 2012 17:36:08
rrd info: https://pastee.org/qqxg8
48hr graph command: https://pastee.org/6yahu
10d graph command: https://pastee.org/gpk24
48hr graph: Loading Image...

10d graph: Loading Image...

- --
Munroe Sollog
LTS - Network Analyst
x85002