rseiwert
2015-08-12 19:01:25 UTC
The Least Squares Line (LSL) in RRD just produces a line. Just a line. It doesn't bend. It takes all the data points you have and calculates a line that best approximates a path that passes through all data points. The relatively high values on the end of your graph gives your LSL trend a high slope and the negative values at the beginning. There are better ways to forecast usage than LSL but they also add complexity into the mix.
LSLSLOPE, LSLINT, LSLCORREL (from http://oss.oetiker.ch/rrdtool/doc/rrdgraph_rpn.en.html)
Return the parameters for a Least Squares Line (y = mx +b) which approximate the provided dataset. LSLSLOPE is the slope (m) of the line related to the COUNT position of the data. LSLINT is the y-intercept (b), which happens also to be the first data point on the graph. LSLCORREL is the Correlation Coefficient (also known as Pearson's Product Moment Correlation Coefficient). It will range from 0 to +/-1 and represents the quality of fit for the approximation.
You are right, step is not related to your issue but step size will impact your results. Just a warning not to open your graph's date range too far to avoid averaging/watering down your data. If you use LSLCORREL (which I do) to validate the trend watering down your data will also inflate and produce an invalid correlation coefficient.
From: Ondrej [via RRD Mailinglists] [mailto:ml-node+***@n2.nabble.com]
Sent: Wednesday, August 12, 2015 2:22 PM
To: Robert C. Seiwert <***@vcaglobal.com>
Subject: [GRAYMAIL] RE: RE: Question about trend line
Thank you for comprehensive response. I am actually monitoring WAN0 interface data traffic, so problem is not related to disk space monitoring. I also watched the YT presentation and found this very useful. You are right, that my graph had limits set and when i removed them i got graph like this, having negative integer at first two days. Admitting i am not sure how your method step size method can remedy my problem, that trend line goes to negative area. can you explain further?
[Loading Image...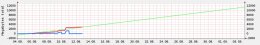 ]
]
________________________________
If you reply to this email, your message will be added to the discussion below:
http://rrd-mailinglists.937164.n2.nabble.com/Question-about-trend-line-tp7583077p7583083.html
To start a new topic under RRDtool Users Mailinglist, email ml-node+***@n2.nabble.com<mailto:ml-node+***@n2.nabble.com>
To unsubscribe from RRD Mailinglists, click here<http://rrd-mailinglists.937164.n2.nabble.com/template/NamlServlet.jtp?macro=unsubscribe_by_code&node=937164&code=cm9iQHZjYWdsb2JhbC5jb218OTM3MTY0fC0yMTE0MzU4MzIz>.
NAML<http://rrd-mailinglists.937164.n2.nabble.com/template/NamlServlet.jtp?macro=macro_viewer&id=instant_html%21nabble%3Aemail.naml&base=nabble.naml.namespaces.BasicNamespace-nabble.view.web.template.NabbleNamespace-nabble.view.web.template.NodeNamespace&breadcrumbs=notify_subscribers%21nabble%3Aemail.naml-instant_emails%21nabble%3Aemail.naml-send_instant_email%21nabble%3Aemail.naml>
--
View this message in context: http://rrd-mailinglists.937164.n2.nabble.com/Question-about-trend-line-tp7583077p7583084.html
Sent from the RRDtool Users Mailinglist mailing list archive at Nabble.com.
LSLSLOPE, LSLINT, LSLCORREL (from http://oss.oetiker.ch/rrdtool/doc/rrdgraph_rpn.en.html)
Return the parameters for a Least Squares Line (y = mx +b) which approximate the provided dataset. LSLSLOPE is the slope (m) of the line related to the COUNT position of the data. LSLINT is the y-intercept (b), which happens also to be the first data point on the graph. LSLCORREL is the Correlation Coefficient (also known as Pearson's Product Moment Correlation Coefficient). It will range from 0 to +/-1 and represents the quality of fit for the approximation.
You are right, step is not related to your issue but step size will impact your results. Just a warning not to open your graph's date range too far to avoid averaging/watering down your data. If you use LSLCORREL (which I do) to validate the trend watering down your data will also inflate and produce an invalid correlation coefficient.
From: Ondrej [via RRD Mailinglists] [mailto:ml-node+***@n2.nabble.com]
Sent: Wednesday, August 12, 2015 2:22 PM
To: Robert C. Seiwert <***@vcaglobal.com>
Subject: [GRAYMAIL] RE: RE: Question about trend line
Thank you for comprehensive response. I am actually monitoring WAN0 interface data traffic, so problem is not related to disk space monitoring. I also watched the YT presentation and found this very useful. You are right, that my graph had limits set and when i removed them i got graph like this, having negative integer at first two days. Admitting i am not sure how your method step size method can remedy my problem, that trend line goes to negative area. can you explain further?
[Loading Image...
 ]
]________________________________
If you reply to this email, your message will be added to the discussion below:
http://rrd-mailinglists.937164.n2.nabble.com/Question-about-trend-line-tp7583077p7583083.html
To start a new topic under RRDtool Users Mailinglist, email ml-node+***@n2.nabble.com<mailto:ml-node+***@n2.nabble.com>
To unsubscribe from RRD Mailinglists, click here<http://rrd-mailinglists.937164.n2.nabble.com/template/NamlServlet.jtp?macro=unsubscribe_by_code&node=937164&code=cm9iQHZjYWdsb2JhbC5jb218OTM3MTY0fC0yMTE0MzU4MzIz>.
NAML<http://rrd-mailinglists.937164.n2.nabble.com/template/NamlServlet.jtp?macro=macro_viewer&id=instant_html%21nabble%3Aemail.naml&base=nabble.naml.namespaces.BasicNamespace-nabble.view.web.template.NabbleNamespace-nabble.view.web.template.NodeNamespace&breadcrumbs=notify_subscribers%21nabble%3Aemail.naml-instant_emails%21nabble%3Aemail.naml-send_instant_email%21nabble%3Aemail.naml>
--
View this message in context: http://rrd-mailinglists.937164.n2.nabble.com/Question-about-trend-line-tp7583077p7583084.html
Sent from the RRDtool Users Mailinglist mailing list archive at Nabble.com.